Electric cars now account for one in every four new cars sold worldwide. Global electric car sales passed 20 million in 2025, while public charging infrastructure grew to more than seven million charging points.
These electric car statistics show that EV adoption is no longer limited to a small group of wealthy markets. China remains the largest electric car market, Europe recorded strong growth, and several countries in Southeast Asia, Latin America and the Middle East reported sharp increases in sales.
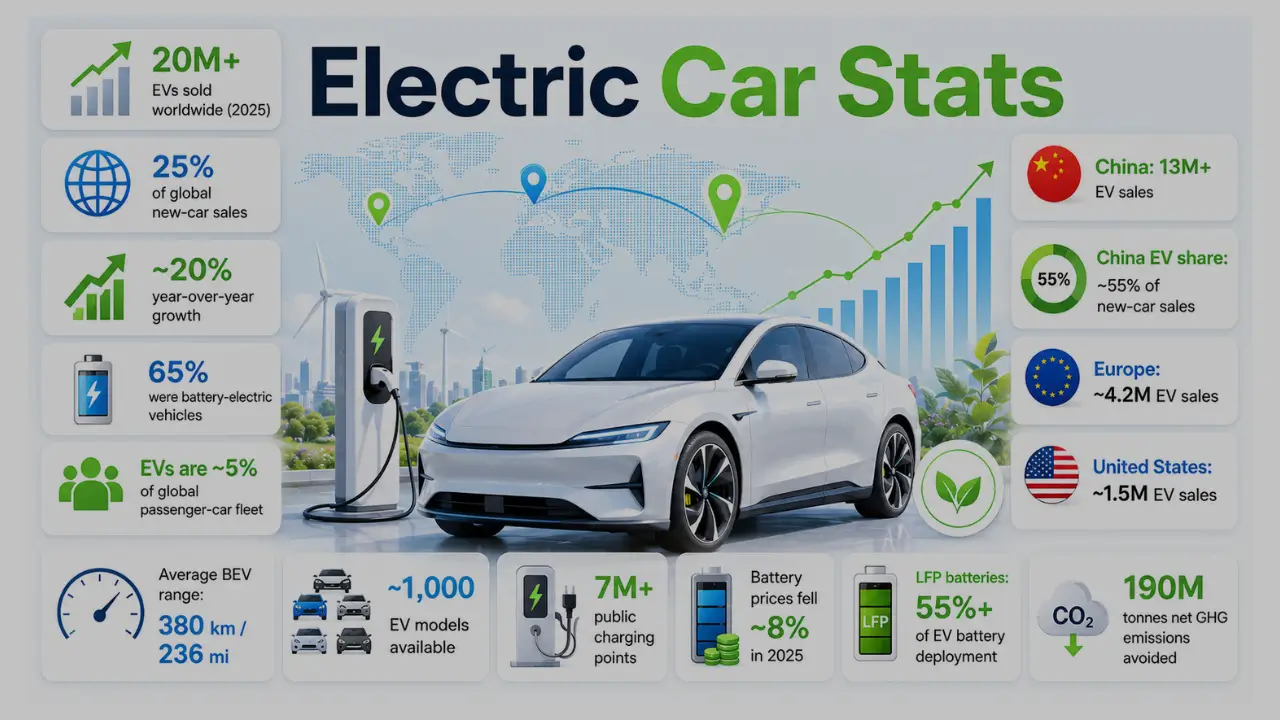
More than 20 million electric cars were sold worldwide in 2025, representing 25% of all new car sales. Global sales are expected to reach around 23 million in 2026, bringing the market share close to 30%.
Key Statistics at a Glance
- More than 20 million electric cars were sold worldwide in 2025.
- Electric cars made up 25% of global new-car sales.
- Global EV sales grew by approximately 20% year over year.
- China sold more than 13 million electric cars.
- Electric cars represented almost 55% of new-car sales in China.
- Europe sold approximately 4.2 million electric cars.
- The United States sold around 1.5 million electric cars.
- Approximately 65% of electric cars sold globally were battery-electric vehicles.
- Electric cars now account for about 5% of the global passenger-car fleet.
- The average battery-electric car offers nearly 380 kilometres or 236 miles of range.
- Nearly 1,000 electric car models were available worldwide in 2025.
- More than seven million public charging points were operating globally.
- Average battery prices fell by approximately 8% in 2025.
- Lithium iron phosphate batteries accounted for more than 55% of global EV battery deployment.
- Electric vehicles avoided an estimated 190 million tonnes of net greenhouse gas emissions in 2025.
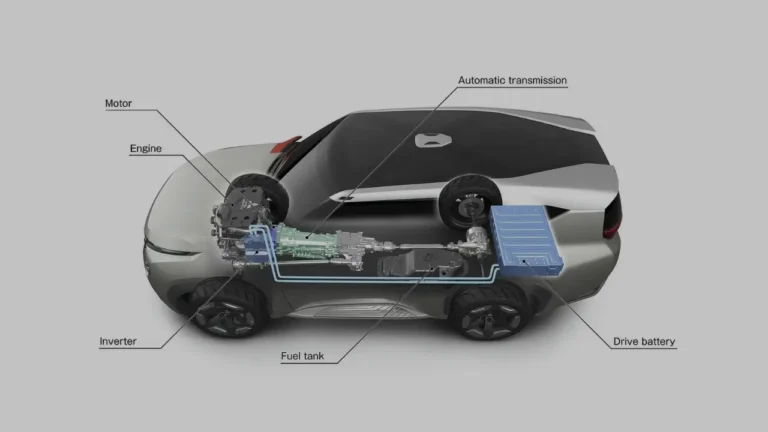
Drivers comparing models can read our guide to how electric cars work.
Global Electric Car Sales Statistics
More than 20 million electric cars were sold worldwide in 2025. This was approximately 20% higher than in 2024 and marked another annual increase of roughly 3.5 million vehicles.
Electric cars accounted for 25% of all new cars sold worldwide. In other words, one in every four new-car buyers selected either a battery-electric or plug-in hybrid vehicle.
Battery-electric cars represented approximately 65% of global electric car sales. This means fully electric vehicles continued to outsell plug-in hybrids at the global level.
Global electric car sales growth
| Year | Approximate global electric car sales | Share of new-car sales |
| 2020 | Around 3 million | About 4% |
| 2021 | Around 6.5 million | About 9% |
| 2022 | More than 10 million | About 14% |
| 2023 | Around 14 million | About 18% |
| 2024 | More than 17 million | More than 20% |
| 2025 | More than 20 million | 25% |
| 2026 forecast | Around 23 million | Close to 30% |
The figures show how quickly the market has changed. Annual electric car sales in 2025 were more than six times higher than in 2020.
Electric Car Sales by Country and Region
Electric car adoption differs greatly between markets. Vehicle prices, government policy, charging access, electricity costs, fuel prices and local manufacturing all affect demand.
| Market | 2025 electric car sales | Share of new-car sales |
| Global | More than 20 million | 25% |
| China | More than 13 million | Almost 55% |
| Europe | Around 4.2 million | 28% |
| European Union | Almost 3 million | Just under 27% |
| United States | Around 1.5 million | Just under 10% |
| Norway | Not stated here | About 97% |
| United Kingdom | More than 700,000 combined EVs | More than 33% |
| Germany | Around 850,000 | Around 30% |
| Türkiye | Nearly 240,000 | More than 20% |
| India | Around 165,000 | Nearly 4% |
| Brazil | Around 180,000 | About 9% |
| Middle East | Around 75,000 | Varies by country |
| Africa | Around 25,000 | Generally below major markets |
China
China accounted for six out of every ten electric cars sold worldwide in 2025. More than 13 million electric cars were sold in the country, taking the sales share to almost 55%.
An estimated 44 million electric cars were operating on Chinese roads by the end of 2025. That represented approximately 13% of the country’s passenger-car fleet.
Europe
Europe recorded more than 30% growth in electric car sales, reaching around 4.2 million vehicles. Electric cars represented 28% of all new cars sold across the region.
Germany remained Europe’s largest electric car market, while Norway continued to lead the world by sales share. Approximately 97% of new cars sold in Norway were electric in 2025.
United States
Approximately 1.5 million electric cars were sold in the United States in 2025. Electric vehicles accounted for just under 10% of new-car sales.
Sales were relatively stable for the full year but dropped sharply during the final quarter following policy and tax-credit changes.
Emerging electric car markets
Sales outside China, Europe and the United States reached approximately two million vehicles in 2025, almost 50% higher than the previous year.
Southeast Asian electric car sales more than doubled to over half a million. Electric cars represented nearly 40% of new sales in Viet Nam, almost 25% in Thailand and 15% in Indonesia.
Sales also increased in India, Brazil, Mexico, the Middle East and parts of Africa. Many of these markets have benefited from a wider supply of lower-priced Chinese electric cars.
How Many Electric Cars Are on the Road?
Electric cars still represent a smaller share of the total global vehicle fleet than their share of new sales.
Approximately 5% of the world’s passenger-car stock was electric by the end of 2025. The global electric light-duty vehicle fleet, which includes passenger cars and light commercial vehicles, reached around 76 million.
This difference exists because cars commonly remain on the road for well over a decade. Even when electric vehicles gain a large share of new sales, replacing the existing petrol and diesel fleet takes many years.
Electric Car Model Statistics
Approximately 2,500 passenger-car models were available globally in 2025. Nearly 1,000 were electric, representing about 40% of the total model market.
The number of electric models increased by slightly more than 25% in one year and more than doubled over five years.
Battery-electric cars accounted for approximately 65% of available electric models. The remaining share mainly consisted of plug-in hybrids.
Best-selling electric cars
Five models accounted for approximately 20% of global battery-electric car sales in 2025:
| Model | Share of global BEV sales |
| Tesla Model Y | Nearly 8% |
| Tesla Model 3 | Around 3.6% |
| Geely Geome Xingyuan | Around 3.5% |
| Wuling HongGuang Mini EV | Around 3.1% |
| BYD Seagull | Around 3% |
Although buyers have far more choice than they did a few years ago, sales remain concentrated among a relatively small number of popular models.
Readers comparing current choices can view our guide to the best electric cars.
Electric Car Range Statistics
The average battery-electric car offered nearly 380 kilometres, or approximately 236 miles, of driving range in 2025.
Average global range has levelled off in recent years. Carmakers are increasingly balancing range against vehicle price, battery weight, energy use and charging speed.
The typical daily driving distance in many markets is around 40 kilometres, or 25 miles. In the United States, the average is closer to 65 kilometres, or 40 miles.
This means an average modern BEV can cover several days of ordinary commuting before needing to be charged.
Why are EV batteries not getting much larger?
Adding more battery capacity can increase range, but it also adds weight and cost. Heavier vehicles need more energy to move, which reduces part of the benefit.
Faster public charging and denser charging networks also reduce the need for extremely large battery packs.
Anyone considering an EV should compare official range ratings with motorway use, local temperatures, driving style, passenger load and access to charging.
Electric Car Price Statistics
Electric car prices declined across several major markets in 2025, although affordability still differs by region.
- Average BEV prices fell by more than 10% in China.
- Average BEV prices fell by approximately 6% in Germany.
- Average BEV prices fell by nearly 2% in the United States.
- Around 30% of BEV models in China started below $20,000.
- Fewer than 10% of European BEV models started below $30,000.
- The United States had nearly 20 EV models with entry prices below $40,000.
China has made the most progress toward purchase-price parity. Nearly 70% of BEVs sold there in 2025 were cheaper than comparable petrol cars before government incentives.
Europe and the United States still have fewer low-cost electric options, partly because SUVs and larger vehicles account for a high percentage of new-car demand.
Purchase price should not be assessed alone. Buyers should also compare charging, servicing, depreciation, insurance and battery warranty costs. Our guide to electric-car ownership costs can help readers estimate the full financial impact.
Electric Car Charging Statistics
More than seven million public charging points were operating worldwide by the end of 2025.
Nearly 1.8 million public points were added during the year, increasing the global network by more than 33%.
Public EV charging figures
| Charging statistic | 2025 figure |
| Global public charging points | More than 7 million |
| New public points added | Nearly 1.8 million |
| Annual network growth | More than 33% |
| Electric LDVs per public point | Around 11 |
| Public charging capacity per electric LDV | Around 4.5 kW |
| China’s share of public points | More than 65% |
| Global fast and ultra-fast points | Around 2.2 million |
| US fast and ultra-fast points | Nearly 70,000 |
China operated more than 4.7 million public charging points, accounting for over 65% of the global total.
Europe’s public network grew by approximately 20%. The Netherlands had about 210,000 points, Germany 196,000 and France 185,000.
The United States had more than 160,000 slower public points and nearly 70,000 fast or ultra-fast points.
Home charging statistics
Private light-duty charging points reached more than 43 million worldwide in 2025.
Most electric car owners charge at home or work. Survey data reviewed by the IEA indicated that EV owners completed almost 75% of charging privately and used public fast chargers for only around 10% of charging sessions.
Our home and public EV charging guide explains charging speeds, connector types and typical charging times.
Fast-charging facts
A 150 kW charger can add close to 180 kilometres, or 112 miles, of driving range in approximately 15 minutes when the vehicle and battery conditions support that charging rate.
However, only around 160 BEV models available in 2025 could accept more than 150 kW. Only 50 models could charge above 250 kW.
The power shown on a charging station is its maximum output. The car’s battery temperature, state of charge and internal charging limit determine the rate it can actually accept.
Electric Car Running-Cost Statistics
A battery-electric car uses approximately 70% less energy per kilometre than a similar petrol vehicle.
Home charging has generally produced annual energy-cost savings of around $550 to $1,000 compared with petrol in major EV markets since 2020.
In the United States, the IEA estimated that a typical BEV saved approximately $860 in annual energy costs during 2025 when compared with a petrol car.
Public rapid charging is usually more expensive than home electricity. Relying only on fast public chargers can remove much of the running-cost advantage and may cost more than petrol in some markets.
Servicing expenses may also be lower because BEVs do not need engine oil, spark plugs, exhaust repairs or many other combustion-engine maintenance items. They still require tyres, brakes, suspension work, cabin filters, coolant checks and other routine care.
See our electric car maintenance checklist for a full service breakdown.
Electric Car Battery Statistics
Battery prices declined by an average of approximately 8% in 2025. Lower manufacturing costs, changing battery chemistry and intense competition contributed to the reduction.
Average EV battery size
| Market | Average BEV battery size |
| United States | Around 90 kWh |
| European Union | Close to 70 kWh |
| China | Below 60 kWh |
The larger average battery size in the United States partly reflects strong demand for SUVs, pickups and other large vehicles.
LFP battery market share
Lithium iron phosphate, or LFP, batteries accounted for more than 55% of global EV battery deployment in 2025, up from almost 50% in 2024.
LFP battery packs were more than 40% cheaper per kilowatt-hour than nickel manganese cobalt packs on average.
LFP batteries do not use cobalt and are widely used in lower-cost and standard-range electric cars. Nickel-based batteries remain common where higher energy density is a priority.
Regional battery price differences
Battery pack prices in China were approximately:
- 30% lower than in North America
- 35% lower than in Europe
These cost differences affect where electric cars can reach price parity with petrol vehicles and where manufacturers choose to produce batteries and vehicles.
Battery degradation varies by chemistry, climate, charging habits and thermal management. Readers researching used EVs should review the electric-car battery lifespan guide before buying.
Electric Car Manufacturing Statistics
Nearly 22 million electric cars were produced worldwide in 2025, more than 25% higher than in 2024.
China manufactured around 16 million electric cars and accounted for nearly 75% of global production.
Chinese electric car exports more than doubled to over 2.5 million units. Approximately one-quarter of all electric cars produced globally were traded between major manufacturing and consumer markets.
Manufacturing concentration gives China major influence over global EV pricing, supply chains, battery technology and export volumes.
Electric Cars and Emissions
Battery-electric vehicles produce no tailpipe emissions. They do not release exhaust carbon dioxide, nitrogen oxides or other combustion pollutants while being driven.
Their total environmental impact is not zero. Electricity generation, battery production, vehicle manufacturing, tyre wear and end-of-life processing all create emissions or other environmental effects.
The amount of carbon associated with charging depends on the local electricity mix. An EV charged mainly with renewable or nuclear power has lower operational emissions than one charged on a coal-heavy grid.
Even after electricity-generation emissions were counted, the global EV fleet avoided an estimated 190 million tonnes of net CO2-equivalent emissions in 2025.
Under current-policy projections, annual avoided emissions from EV adoption could exceed 1.2 billion tonnes of CO2-equivalent by 2035.
Electric Cars and Oil Consumption
Electric vehicles displaced approximately 1.7 million barrels of oil per day in 2025 when electric cars, vans, buses, trucks and two- or three-wheelers were counted together.
Electric passenger cars were responsible for most of this reduction.
Based on current policies, global oil displacement from EVs could rise to approximately five million barrels per day by 2030 and around nine million barrels per day by 2035.
This effect is particularly important for countries that import large amounts of petrol and diesel.
How Much Electricity Do EVs Use Globally?
The global electric vehicle fleet consumed approximately 250 terawatt-hours of electricity in 2025.
That represented about 1% of global final electricity demand.
Under current policies, EV electricity use could exceed 1,500 terawatt-hours by 2035. Even at that level, it would represent approximately 4% of worldwide electricity demand.
Grid demand will not depend only on the number of electric cars. Charging time, local grid capacity, fast-charger use, electricity pricing and smart-charging systems will also matter.
Electric Car Forecasts for 2026 and Beyond
The IEA expects global electric car sales to reach approximately 23 million in 2026. Electric cars could account for close to 30% of all new cars sold during the year.
By 2035, the global EV fleet across cars, vans, trucks and buses could exceed 450 million vehicles under current policies, excluding electric two- and three-wheelers.
Growth is expected to spread beyond China, Europe and the United States, with emerging markets accounting for a larger part of future demand.
Forecasts are not guaranteed outcomes. EV adoption will depend on:
- Vehicle affordability
- Charging access
- Fuel and electricity prices
- Battery supply and costs
- Import tariffs
- Local vehicle production
- Emissions and fuel-economy rules
- Purchase incentives and taxes
- Consumer confidence
- Used electric car values
National rules can change quickly. Readers should review current electric vehicle laws and incentives before making a purchase decision.
Electric Car Facts
Electric cars are not a new invention
Electric vehicles existed before the modern petrol-car industry was established. Their current rise is linked to improved batteries, electronics, charging networks and mass production rather than the invention of a completely new type of vehicle.
Most EV charging happens away from public rapid chargers
Although fast-charging hubs receive considerable attention, most owners complete the majority of their charging at home or work.
A larger battery is not always better
A larger pack may increase range, but it can also raise the vehicle’s price, weight and energy use.
Public charger numbers do not tell the full story
A network with fewer high-powered chargers may provide more useful capacity than one with many low-powered points. Location, reliability, payment access and charging speed also matter.
Electric cars still use tyres and brakes
EVs produce no exhaust emissions, but tyre wear still creates particles. Regenerative braking can reduce the use of friction brakes, although it does not remove brake maintenance completely.
Electric car adoption is moving at different speeds
Norway has reached an electric sales share of around 97%, while EVs still represent a small percentage of sales in many developing markets.
What the Statistics Mean for Car Buyers
Electric cars have moved into the mainstream global market, but ownership conditions still vary by location.
An EV is more likely to suit a buyer who has dependable home or workplace charging, predictable daily travel and access to qualified servicing. Buyers who depend entirely on public fast charging need to compare local prices and charger availability carefully.
Range is becoming less of a technical problem for many drivers. Affordability, charging access, resale value and insurance now play a larger role in purchase decisions.
Before choosing a model, compare:
- Real-world range
- Battery warranty
- Maximum DC charging speed
- Home charger installation cost
- Local public charging coverage
- Winter or hot-weather performance
- Insurance premiums
- Used-car resale values
- Replacement tyre costs
- Local taxes and incentives
Our electric car buying guide can help buyers compare these points across individual cars.
Frequently Asked Questions
How many electric cars were sold in 2025?
More than 20 million electric cars were sold worldwide in 2025. They accounted for approximately 25% of global new-car sales.
What percentage of cars sold are electric?
Electric cars represented one in four new cars sold globally in 2025. The sales share is expected to approach 30% in 2026.
Which country sells the most electric cars?
China sells more electric cars than any other country. It recorded more than 13 million sales in 2025 and accounted for approximately 60% of the global market.
Which country has the highest electric car market share?
Norway had one of the world’s highest electric car sales shares in 2025, at approximately 97%.
How many EV charging points are there worldwide?
There were more than seven million public EV charging points globally at the end of 2025, along with more than 43 million private light-duty charging points.
What is the average electric car range?
The global average range of a battery-electric car was nearly 380 kilometres, or 236 miles, in 2025.
Are electric cars cheaper to run?
Home-charged electric cars are generally cheaper to power than comparable petrol cars. The size of the saving depends on electricity prices, fuel prices, mileage and public-charging use.
Do electric cars produce emissions?
Battery-electric cars produce no tailpipe emissions. Emissions may still come from electricity generation, vehicle and battery production, tyres and end-of-life processing.
How long do electric car batteries last?
Battery life depends on chemistry, temperature, charging behaviour and vehicle design. Most manufacturers provide a separate battery warranty, often based on a set number of years, kilometres or minimum retained capacity.
Will electric cars replace petrol cars?
Electric cars are gaining new-car market share, but replacing the full petrol and diesel fleet will take much longer because existing vehicles remain in service for many years.
Disclaimer
Figures may differ slightly between sources because organisations use different vehicle definitions, reporting periods and methods. Rounded numbers are used where the source reports estimates or approximate totals.